
How to read candlestick charts and understand price action
Reading time: 8 minutes
A candlestick chart does more than show whether a market went up or down. Each candle records the opening, highest, lowest and closing prices for a chosen period. Together, these four prices can give traders a quick view of buying and selling pressure. This makes candlesticks a popular starting point for technical analysis. They are frequently used to help traders identify trends, potential reversals and breakouts.
Candlestick patterns can become more useful when read as part of price action trading. Instead of treating one pattern as a signal on its own, traders often consider the broader trend, support and resistance, market structure and what happened before the candle appeared. For beginners, the aim is not to memorise every candlestick pattern, but to understand what price is communicating.
What is a candlestick chart?
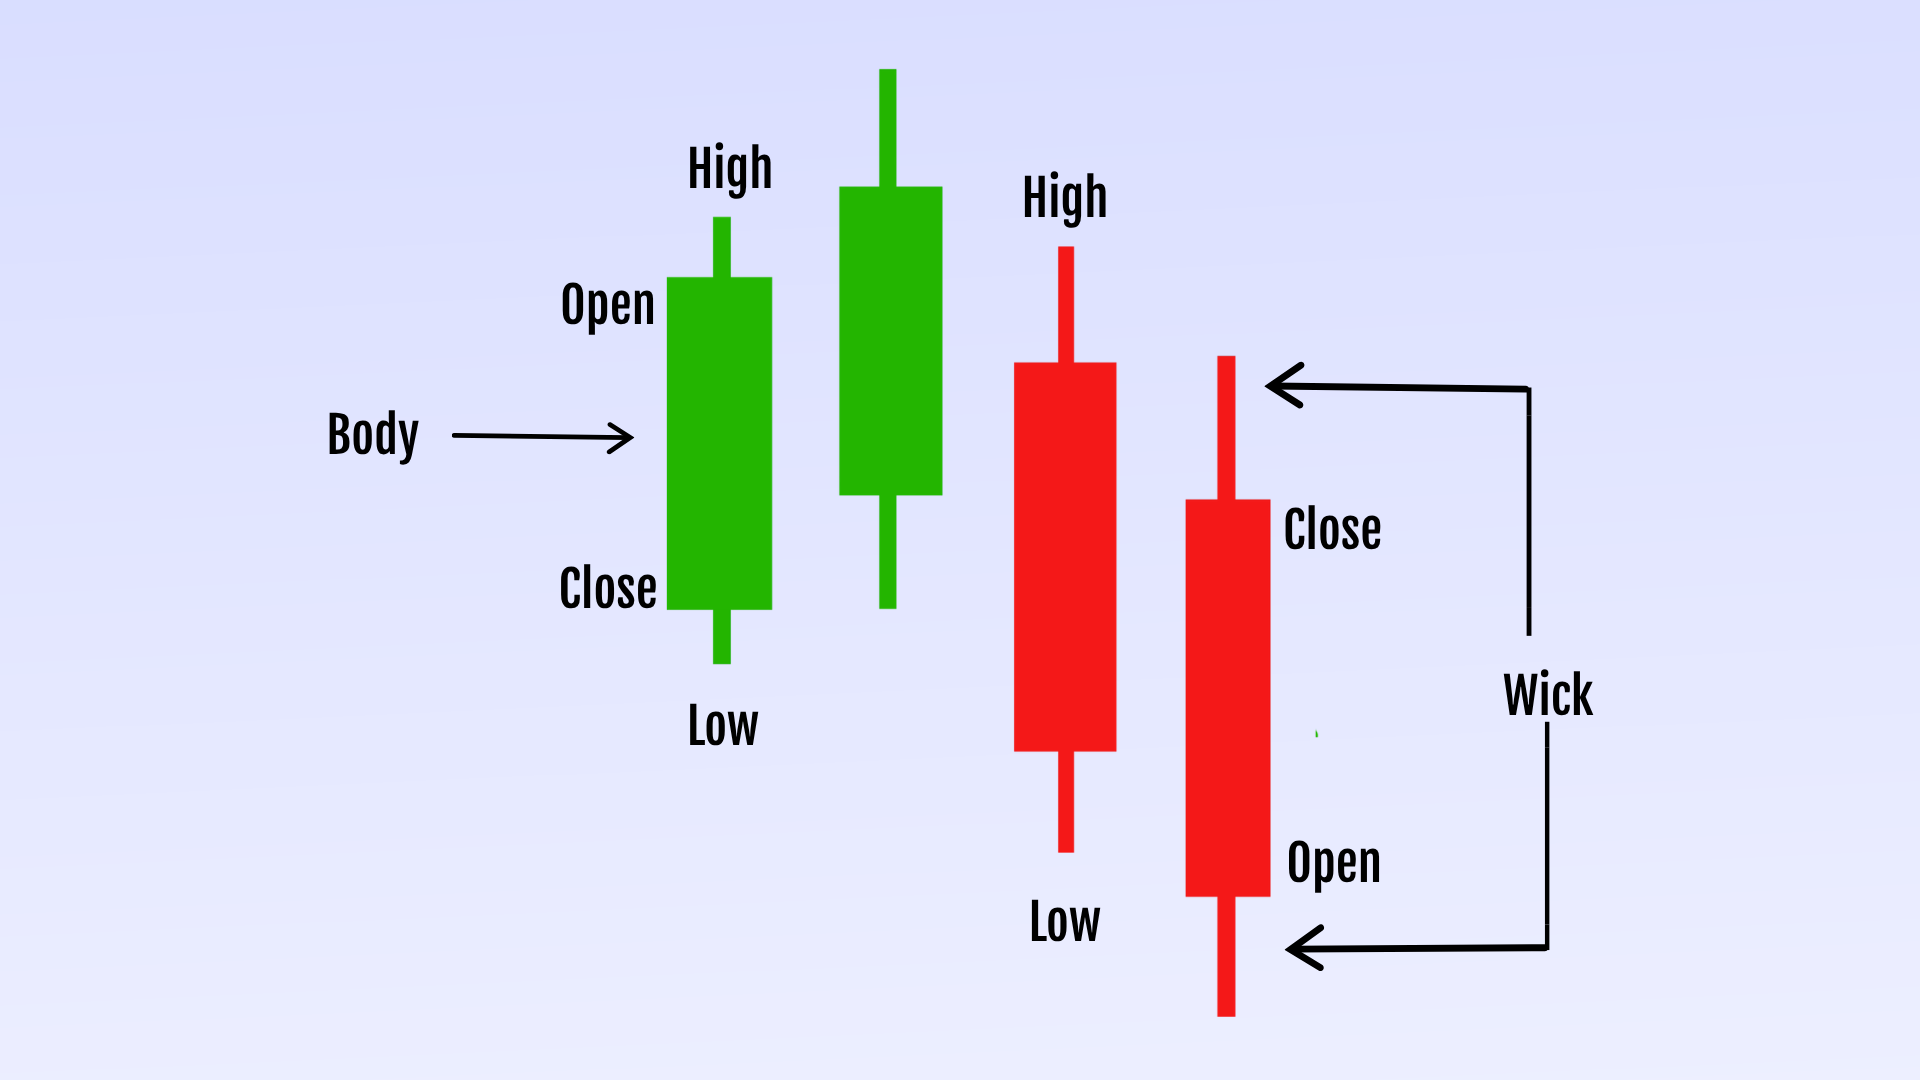
A candlestick shows four prices for a specific period: the open, high, low and close. The body represents the distance between the opening and closing prices. The thin lines above and below the body are called wicks or shadows and show the highest and lowest prices reached during that period. The timeframe determines what each candle represents. On a daily chart, one candle covers one trading day, while on a one-hour chart, it covers one hour. A five-minute chart shows much more short-term price movement.
Bullish and bearish candlesticks
A bullish candlestick closes above its opening price, while a bearish candle closes below it. Platforms often show bullish candles in green and bearish ones in red. A long bullish body tends to suggest stronger buying pressure. On the other hand, a long bearish body commonly indicates stronger selling pressure.
The wicks matter too. A long upper wick shows that price moved higher but closed below its high, which can suggest selling pressure at higher prices. A long lower wick often shows that sellers pushed price lower before buyers recovered some of the decline.
A small body means the open and close were relatively close. It can indicate uncertainty or a balance between buyers and sellers. The size of the candle body is often used to assess the intensity of buying or selling during the period.
Candlestick pattern example
Common candlestick chart patterns
Doji
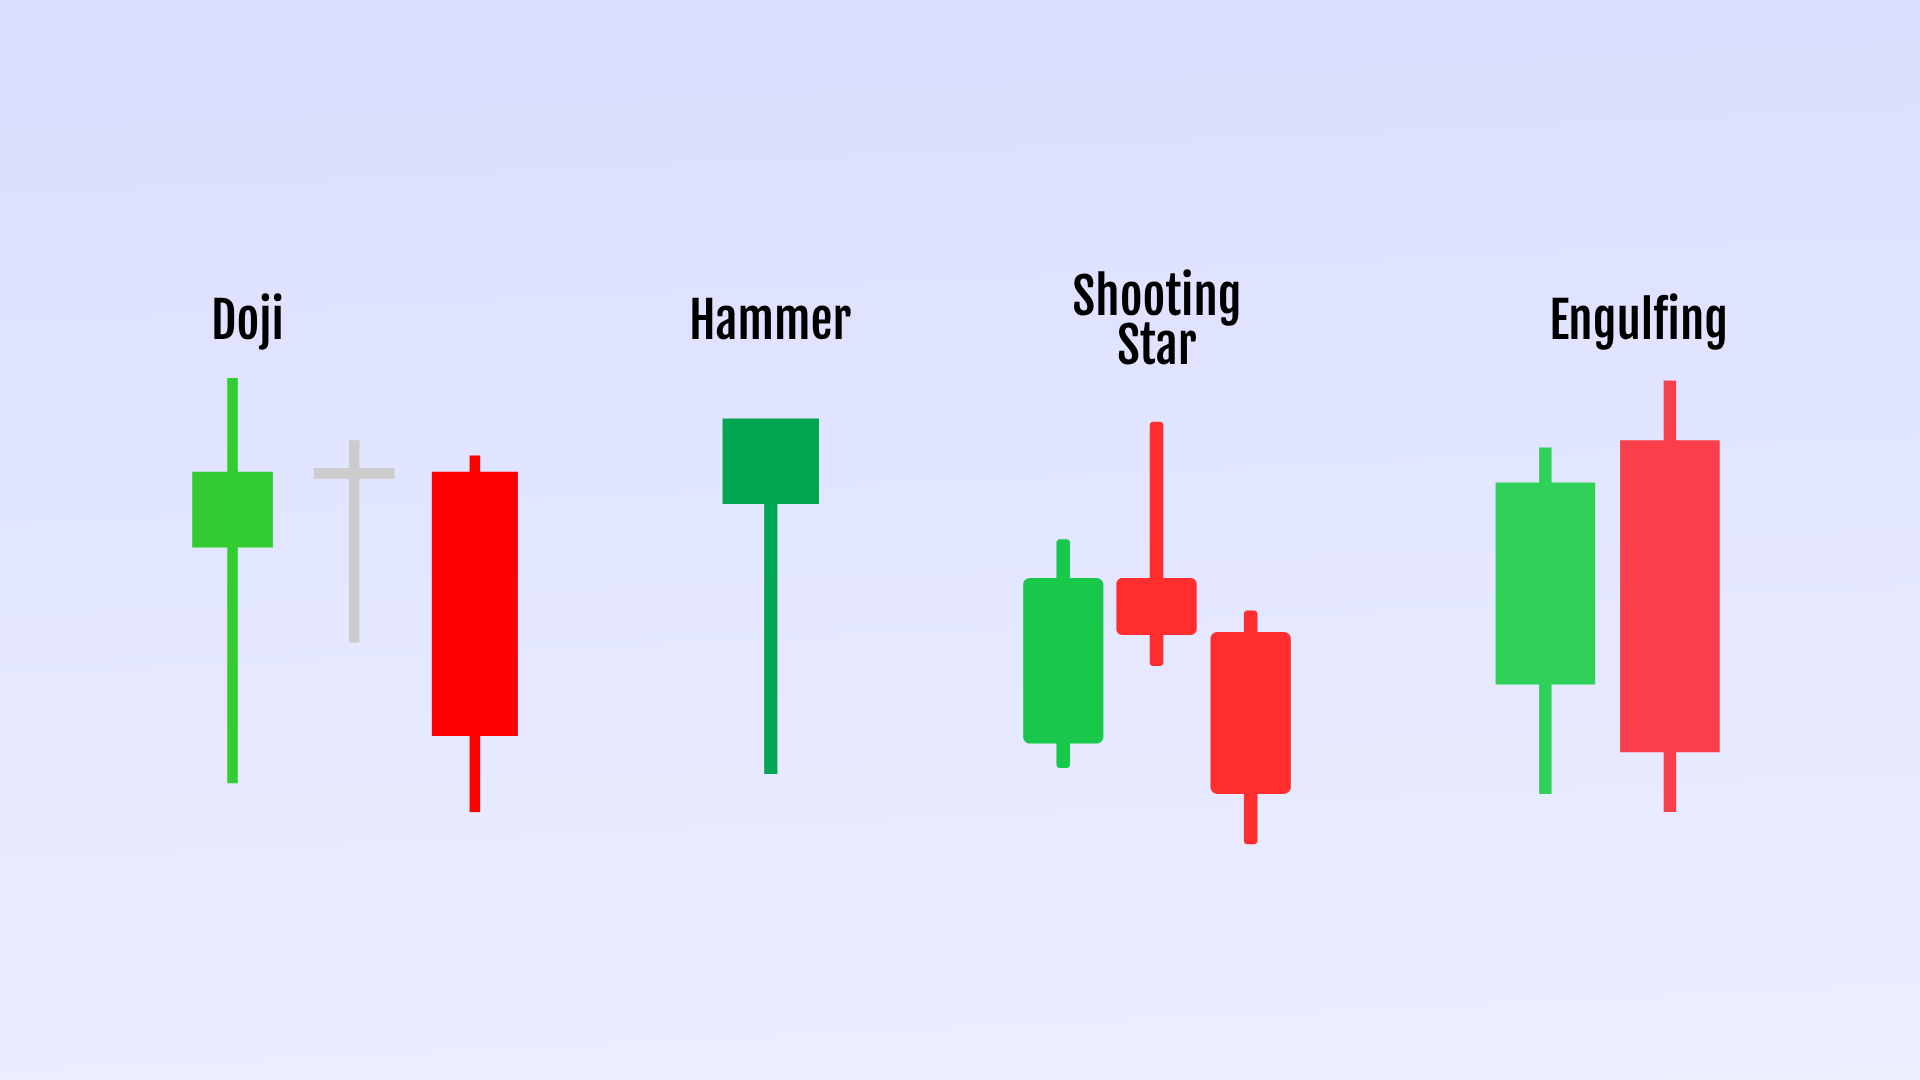
A doji forms when the open and close are very close together. It can be worth watching after a strong trend, but it does not automatically signal a reversal.
Hammer
A hammer has a small body and a long lower wick. It often appears after a decline and can suggest that buyers rejected lower prices. It tends to carry more weight near support.
Shooting star
A shooting star has a small body and a long upper wick. It can appear after an advance and suggests that buyers pushed higher but could not maintain those gains. Near resistance, it may warn of increasing selling pressure.
Engulfing pattern
A bullish engulfing pattern occurs when a larger bullish candle follows a smaller bearish candle and covers its entire body. A bearish engulfing pattern is the opposite. These patterns can indicate a change in short-term momentum, but their location matters. A bullish engulfing candle at established support can provide more useful information than the same pattern appearing randomly in the middle of a trading range.
Candlestick chart types
How to use candlestick patterns to read price action
Candlestick patterns can help traders understand what buyers and sellers are doing at important points on a chart. The key is to look beyond the shape of one candle. Traders usually consider the pattern alongside the broader trend, market structure and key price levels for price action trading.
To do this, start by identifying the direction of the market. An uptrend typically creates higher highs and higher lows, while a downtrend produces lower highs and lower lows. Then, mark important support and resistance levels. These areas can provide context for a candlestick chart.
For example, a hammer near established support can suggest that sellers pushed the price lower, but buyers stepped in and recovered some of the decline. You could then look for subsequent bullish price action as additional evidence to confirm that buying pressure is continuing. Similarly, a shooting star near resistance can indicate that buyers struggled to hold higher prices.
Engulfing patterns can also provide clues. For example, a bullish engulfing pattern after a decline may indicate that buyers are becoming more active. Conversely, a bearish engulfing pattern near resistance can suggest increasing selling pressure.
For beginners learning to read candlestick charts, it is important to remember not to treat these patterns as automatic buy or sell signals. A pattern can fail, especially when the broader market is moving strongly in the opposite direction.
Candlestick patterns can also be considered alongside volume or momentum indicators such as the Relative Strength Index (RSI). The aim is not to fill the chart with indicators, but to find evidence that supports the price-action setup.
The same principle applies to bullish and bearish candlesticks. A long bullish candle means little without context. The same candle at a major resistance level, after an extended rally, may tell a very different story. In short, experienced traders typically read the candle, then read the chart around it to make informed decisions.
Candlestick chart strategies for beginners
Here are three common approaches among beginners learning to use candlestick charts for price action trading:
Trend-following
In an established uptrend, traders may wait for a pullback towards support. They then look for a bullish pattern, such as a hammer or bullish engulfing candle, before considering a long trade. In a downtrend, traders can look for a rally towards resistance followed by a bearish pattern. The aim is to trade with the broader trend rather than predict its end.
Breakout trading
Imagine a stock has traded below resistance for several sessions. A strong bullish candle closes above the level. This close above resistance is generally considered more meaningful than a brief move above it. Some traders wait for a retest of the broken level or use volume for confirmation before entering a trade.
Reversal trading
Traders usually look for evidence that the current trend may be weakening to identify a reversal setup. For example, price reaches major resistance, forms a shooting star and then produces a strong bearish candle. Reversal trading can be more challenging for beginners because a market can continue trending despite an apparently convincing reversal pattern.
Managing risk while reading candlestick patterns
A good chart setup does not eliminate trading risk. Before entering a position, experienced traders often decide where their trade idea becomes invalid. This helps them set a stop-loss and choose an appropriate position size. However, traders usually do not increase risk simply because a pattern looks convincing. This is because even a textbook setup can fail.
Beginners can practise using candlestick charts on a demo account before committing real money. This can also help you build and test your trading strategy under different market conditions before entering the live markets.
Read the chart, not just the pattern
The most useful lesson for beginners learning to read candlestick charts is that context comes first. A hammer, shooting star or engulfing pattern means little on its own. Traders can consider the trend, key levels and what the following candles do. This approach can help turn candlesticks from a collection of shapes into a framework for interpreting price behaviour.
Take your price action skills further
Once you understand candlestick charts, the next step is practising your analysis in a trading environment that gives you the tools to apply it. FP Markets offers access to more than 10,000 instruments across global markets, on trading platforms such as MetaTrader 4, MetaTrader 5, TradingView and cTrader. Learn to capture market moves with tight spreads, fast execution and deep liquidity, while being supported by rich educational resources. Open your account with FP Markets to take your analysis further, explore the markets and continue developing your price action skills.
Frequently asked questions (FAQs)
Hammer, shooting star and engulfing patterns are relatively simple to learn. Their usefulness depends on the trend, price level and surrounding market structure. Once you are confident of these, you can move on to three white soldiers, morning and evening stars, head and shoulders, and more.
There is no universal number. Your strategy often defines what confirmation means. Some setups use one completed candle, while others require a follow-through candle or a break of a key level.
No. They can highlight possible changes in buying and selling pressure, but they cannot guarantee what price will do next. Traders tend to use candlesticks with market structure, support and resistance and proper risk management.